These two technological terms crop up repeatedly in maritime archaeology. But what are Bathymetry and Side-Scan Sonar used for and how do they contribute to understanding and appreciating sub-surface environments? Volunteer Roger Burns takes us through the basic technologies and why they are so useful for maritime archaeologists. Indeed, Roger who has been volunteering with MAT for over seven years and understood end results of bathymetry surveys but not the required technology, found his research fascinating and is grateful for the expert contribution by the MAT’s Brandon Mason.
Bathymetry
Similar in concept to land topography, bathymetry is the equivalent for the beds of oceans, seas, lakes, rivers, estuaries, canals and ponds, including water depths in conjunction with bed profiles. A term such as seabed mapping or seabed imaging is in reality bathymetry, and a bathymetric map is a chart which depicts submerged topography. An isobath, the submerged equivalent of a topographical contour, is an imaginary line which connects all points of equal depth below the surface of a body of water.
Sea levels can vary appreciably due to tidal variations, from less than 2 metres at Lowestoft to as much as 12 metres during Spring tides in the Bristol Channel. Therefore, a common reference or datum level, rather like a datum on land such as OD Newlyn is needed, and such systems include mean sea level (MSL), and chart datum (CD) which is used on a local basis, usually the same as lowest astronomical tide level (LAT). Most marine surveyors use LAT for a specific area or project, including the MAT.
Sea-floor relief variations can be shown on bathymetric maps, depicted by depth colours, as illustrated later, or by isobaths and an example seabed profile is shown in Figure 1. This early bathymetry example would probably have been conducted using sounding leads and may have incorporated tallow to collect sediment samples.
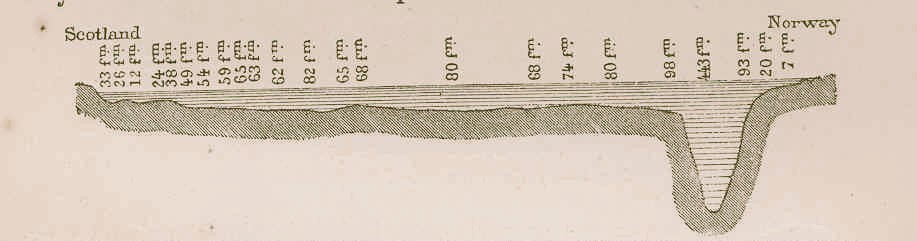
Figure 1: North Sea Bathymetry 1873 – Profile of the Bed of the North sea, from the north point of Scotland to Stavanger, Norway.
Source: Élisée Reclus, Public Domain, via Wikimedia Commons
Any vessel with depth sounding equipment can gather bathymetry, often gathered as part of a hydrographic survey. The International Hydrographic Organisation (IHO) has this definition: Hydrography is the branch of applied sciences which deals with the measurement and description of the physical features of oceans, seas, coastal areas, lakes and rivers, as well as with the prediction of their change over time, for the primary purpose of safety of navigation and in support of all other marine activities, including economic development, security and defence, scientific research, and environmental protection.
Purposes for bathymetric data collection includes Safety of Navigation represented by charts, Dredging, Environmental and Scientific Study, Engineering and Construction such as harbours, bridges, maritime windfarms, oil and gas exploration, and seabed conditions at and in the vicinity of shipwrecks.
Measurement of water depths
A Single-Beam Echo Sounder (SBES) transmits pulses of sound vertically from a ship which gives information about the seabed but only along the path of the ship, illustrated diagrammatically in Figure 2.A. If parallel lines of travel are used, multiple lines of information will be obtained but completely missing any feature between each path.
A Multi-Beam Echo Sounder (MBES) transmits, Figure 2.B, a fan array, or swathe, of pulses of sound which gives information, narrow fore and aft of the ship’s track, but wide either side of the ship, capable of computing multiple depths across differing angles along the swathe. Each pulse can generate hundreds of measurements through the different angles and therefore lateral distance from the ship’s track, thus achieving considerable seabed coverage including underwater objects.
In both cases, the return time of the pulse echo is measured, and knowing the speed of sound in water, depths are computed, multiple depths in the case of the MBES. Understanding speed of sound in water is obviously important but is not the subject of this blog – suffice to say that it differs in different environments, affected by temperature, salinity and pressure and in oceans it varies between about 1,450m/s and 1,570 m/s.
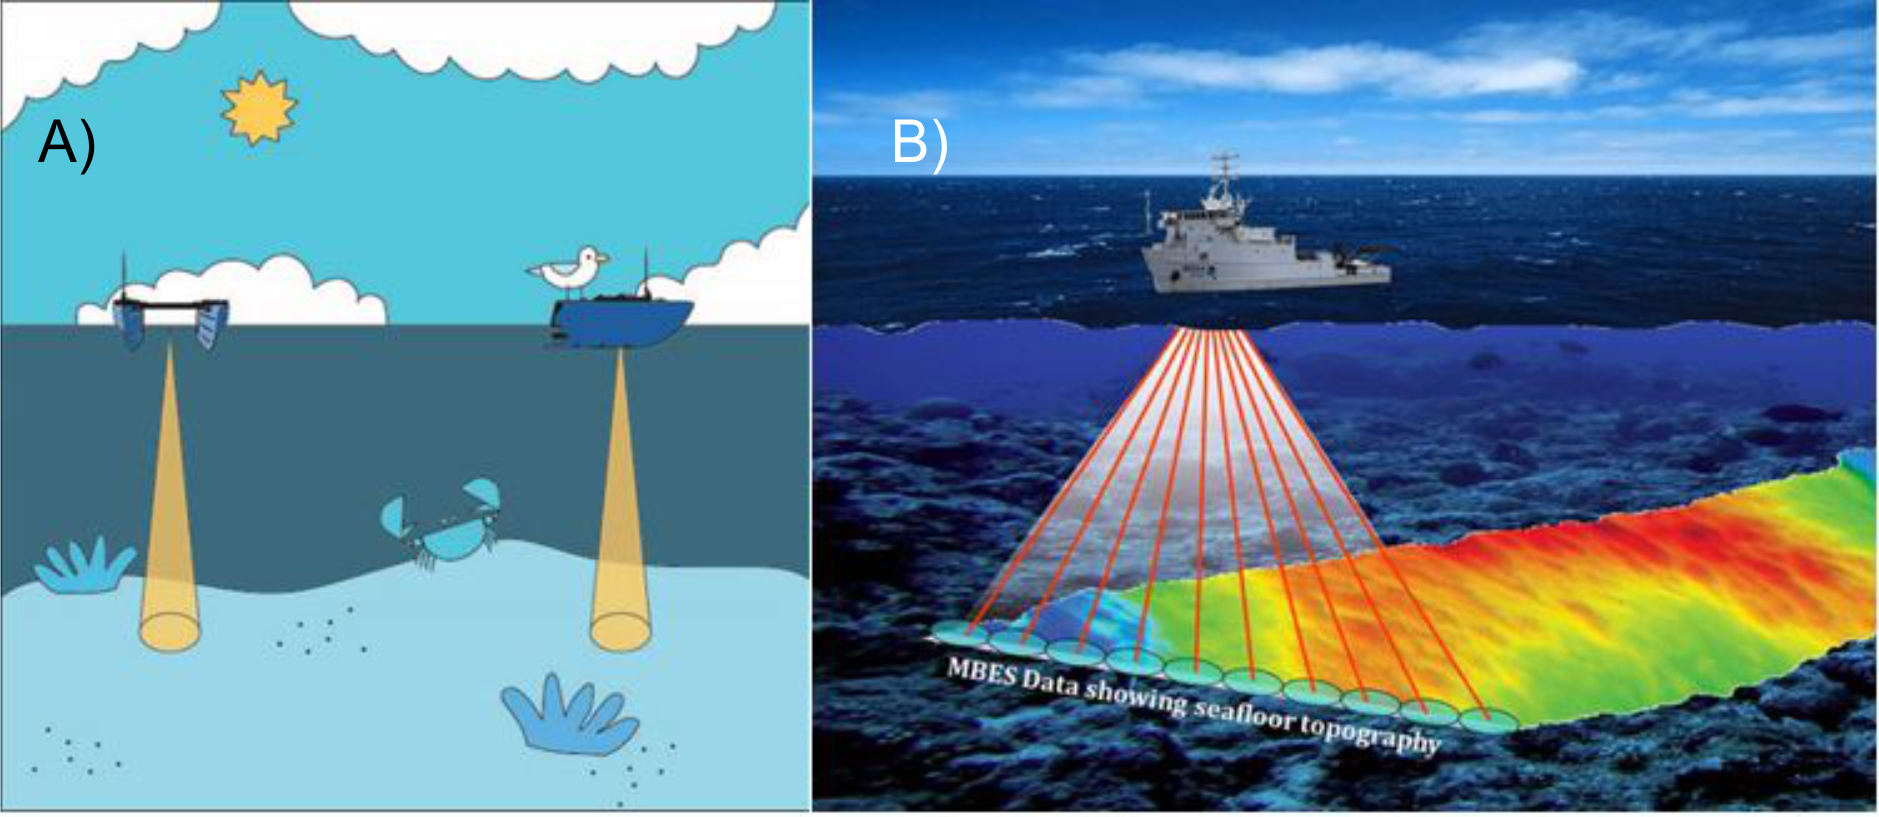
Figure 2.A: Beam Shape, Source: Wikimedia Commons
Figure 2.B: MBES – Beam Shape. Source: NOAA PhotoLibrary, CC BY 2.0, via Wikimedia Commons. Artist’s conception of multibeam sonar on NOAA Ship NANCY FOSTER. NOS/NCCOS/CCMA.
Another system is Lidar which uses rapidly pulsing lasers, usually from an aircraft, which is in a swathe pattern. However, this system is affected by surface waves and water clarity with results similar to MBES but at a lower data density compared with MBES. Nonetheless, it can be effective up to 6m depth for intertidal survey, and may be used by the Channel Coast Observatory as explained here.
Side-Scan Sonar
For surveying large areas of the seabed, a transducer is either fixed to a vessel’s hull, or, to a “towfish” towed behind the vessel. The transducer emits fan-shaped pulses, and as for bathymetry, the echo is measured, recorded, and computed as an image of the seabed. Travelling in a straight line, the results are stitched together, presenting a composite image. These pulses are generated on both sides of the vessel, thus providing a large area of seabed along the vessel’s path, illustrated in Figure 3.
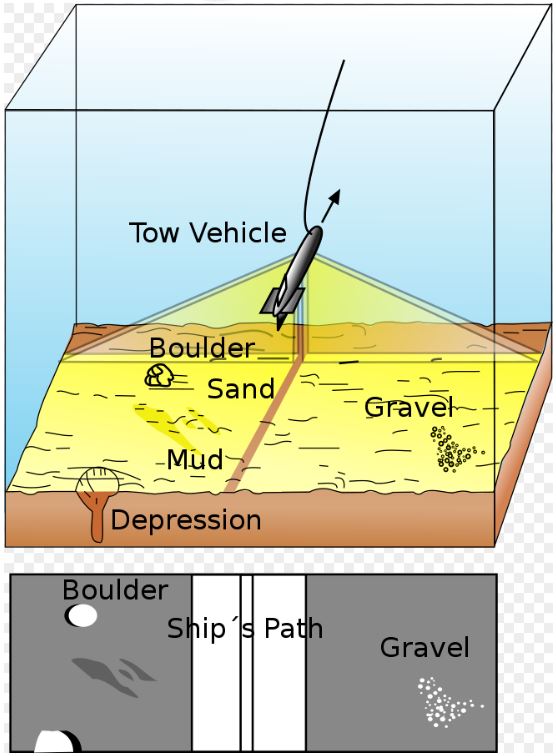
Figure 3: Diagram of a side-scan sonar, Source: USGS & Mysid, Public domain, via Wikimedia Commons
Side-scan sonar is not effective in shallow or deep waters. Deep waters, where towed side scan sonar is usually challenging to deploy, usually requires use of an unmanned Autonomous Underwater Vehicle (AUV) to provide optimal elevation of the transducer above the seabed. It is a popular method for mapping the seabed for underwater archaeology, debris and shipwreck searches, and for environmental monitoring. Once a shipwreck is located, the scanning vessel should travel in a straight line as slowly as possible along the centre-line of the wreck, with a further path either side of the wreck to ensure coverage with additional cross line to box in the discreet seabed feature.
Referencing Results
Data obtained from bathymetry and side-scan sonar requires to be referenced for global positioning, both vertically and horizontally. This is a complex subject and, horizontally, different countries historically use their own datums. Nowadays, horizontal global positioning is more universal, using the World Geodetic System (WGS), currently WGS84 which is a global datum coordinate system and can be expressed in either coordinates or decimals. However, it is not universal, and for example the US often uses NAD83. The MAT generally uses WGS84, but occasionally other datums such as ED50 or ETRS89 with or without projection. Conversion between datums requires a specific transformation formula to be applied. Historical background is available here.
Vertically, we have Chart Datum (CD), Highest and Lowest Astronomical Tides (HAT & LAT), Mean Sea Level (MSL), and Mean High and Low Water Springs (MLWS & MHWS). The MAT generally would give a depth as x.xx metres LAT or CD, or OD, or ‘metres below’ or ‘above mean high water spring (MHWS)’.
It should be noted that both bathymetry sounding and side-scan sonar require operator expertise in set-up and execution, and good experience in interpretation of results.
Examples and Interpretation of the Technologies
As readers will be aware, MAT are heavily involved in investigations of the submerged Mesolithic landscape at Bouldnor Cliff in the Solent on the north shores of the Isle of Wight and two bathymetry images from the site are shown in Figure 4, illustrating the layered features of the strata from the shoreline.
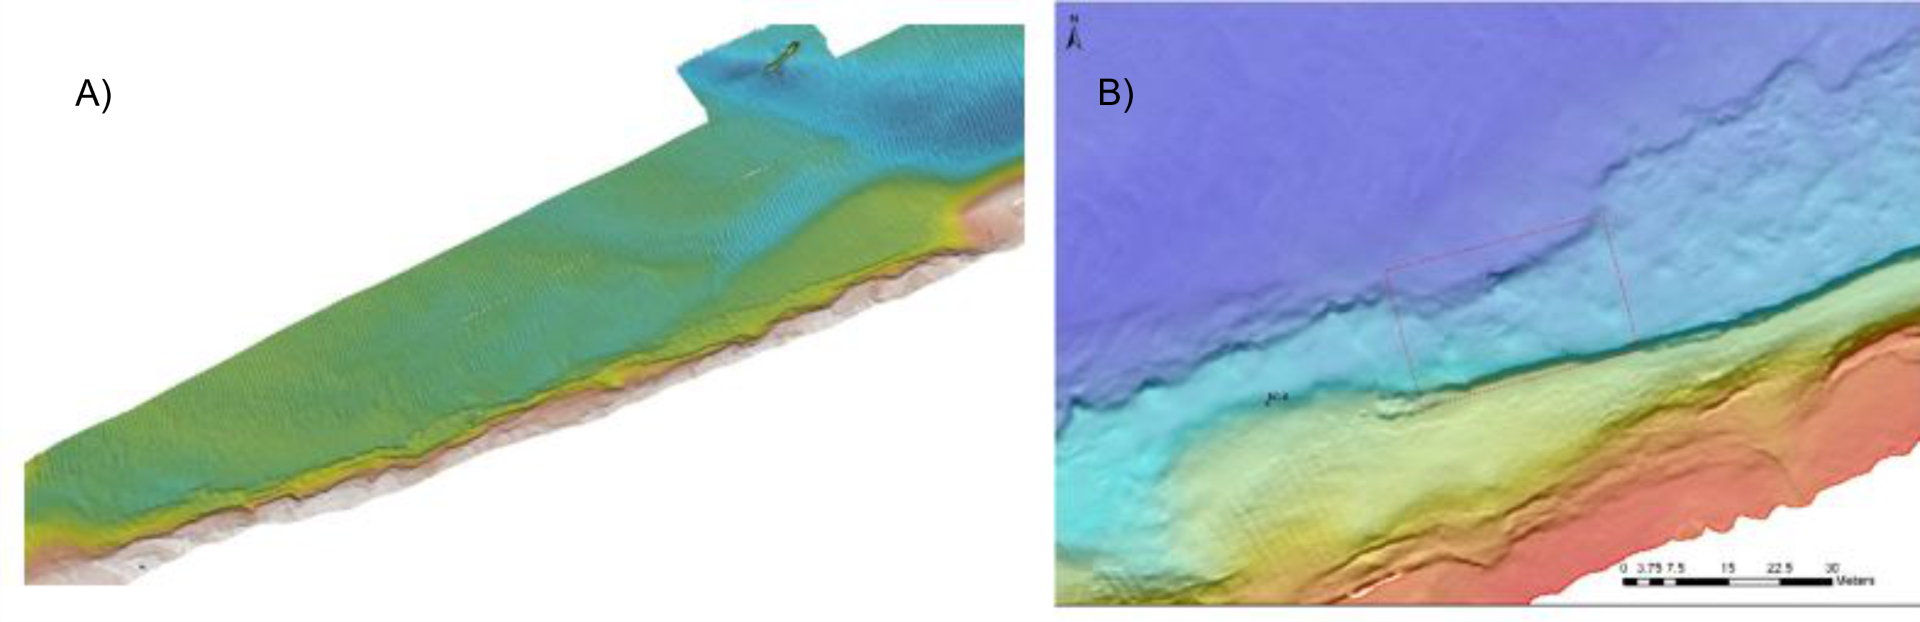
Both images are examples of bathymetry from Bouldnor Cliff.
Figure 4.A: 1km long. Pink is 4m deep. Lower green platform/woodland bench is 11m deep (below OD). Source: Unknown.
Figure 4.B: Another part of the Cliff, with a 30m scale bar. Source: Archaeological Diving Unit.
The object at the top of Figure 4.A, (small due to the scale), is the wreck of the MV Margaret Smith which had five previous names and five previous owners. Launched 17 October 1942 by John Harker Ltd of Knottingley, as a steel hulled, diesel driven, general cargo vessel, it was requisitioned by the Ministry of War Transport until 1947. First two owners were Hull based, then in 1953 converted to a hopper by new owners Fowey Harbour Commissioners, then from 1954 by three different Southampton based owners, the first converting it again to a sand/gravel suction dredger. Approaching Cowes harbour, it was struck by heavy seas causing appreciable roll, the gravel cargo shifted, and it capsized as the crew took to its life raft, but remained afloat and drifted along the Solent. The tug Calshot secured a rope and towed it to a buoy 1km east of Yarmouth where it sank on 28 June 1978. It remains there, intact but on its starboard side, about 6m to 14m deep in strong currents with some scour.
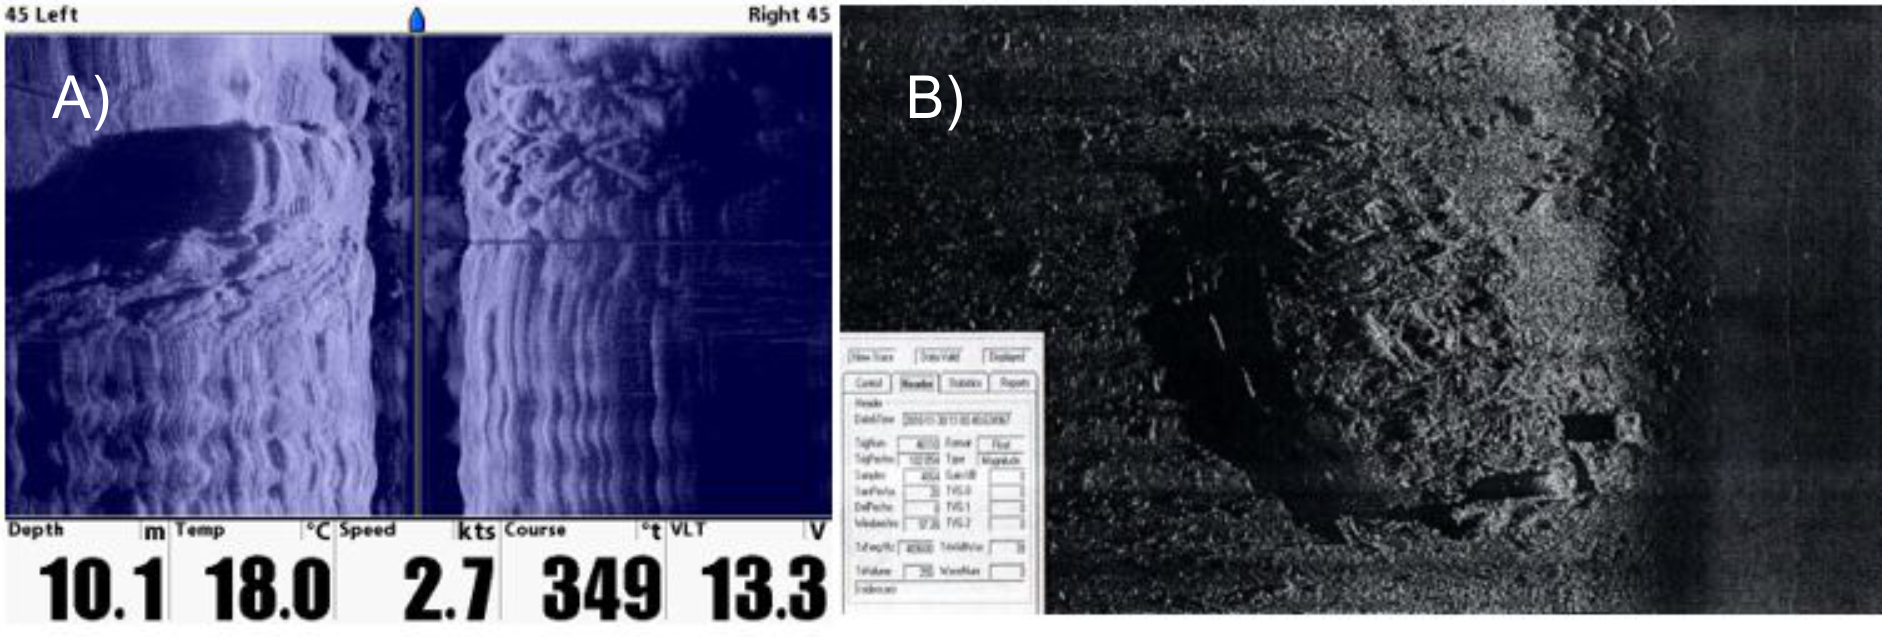
Figures 5A and 5B show two quite different examples, these being of side-scan sonar
You can also read more about the Pomone here.
Apart from illustrating the condition of a wreck, including scattered debris, by reference to as-built plans of the vessel, images when processed from the raw data can show the depths of the seabed, adjacent scour etc by colour grading, such as shown in Figure 6, scour being coloured blue. This is from the Kurland, the history of which including an expanded bathymetry image, is available here.
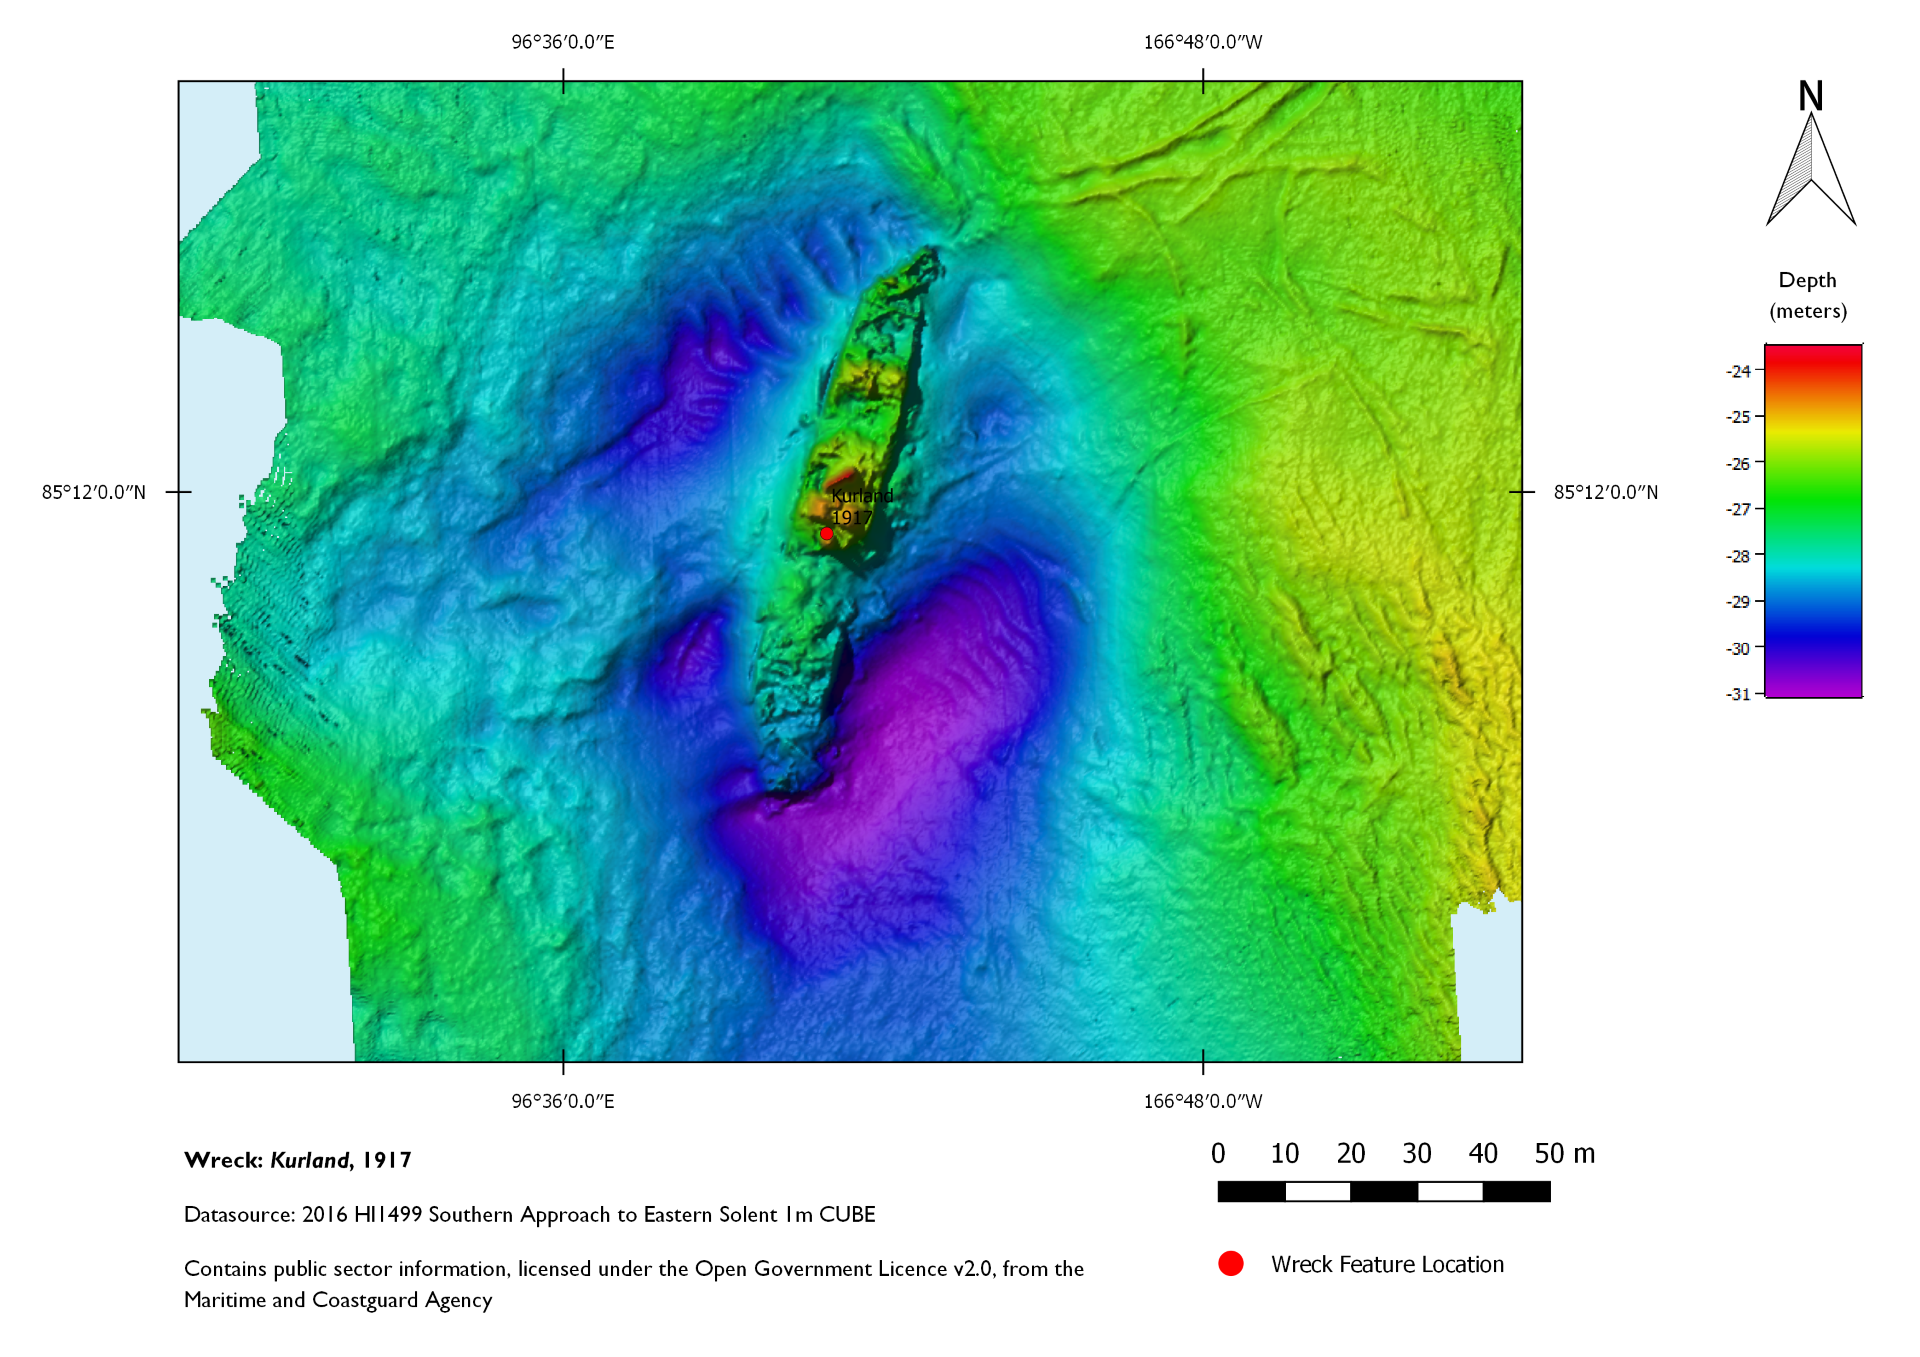
Figure 6: SS Kurland wreck on the seabed
These two distinct but related technologies illustrate information which can be obtained about depths and variations in the seabed, also showing at the time the surveys were performed, the state of shipwrecks and other debris for study by maritime archaeologists.