MAT volunteer, Roger Burns, highlights and describes Newlyn Ordnance and other different datums as applied to height and depth measurements used in everyday life, whether on land or water. In mainland Britain, there is a common datum referred to as Ordnance Datum Newlyn (ODN) used by the Ordnance Survey between 1915 and 1983. The history of ODN is described in some detail with mention of predecessor and successor datums, together with associated maritime datums.
All vertical terrestrial and maritime height measurements are based on a datum. There is a range of datums, including:
- Ordnance Datum Liverpool – the first datum, which originated in 1840 using a bench mark on St. John’s Church. In 1844, the datum was changed to a tidal pole in Victoria Dock with nine days of tidal observations. There is no constant difference across the country between Liverpool and Newlyn datums.
- Ordnance Datum Newlyn (ODN) – the average value of the sea level recorded at Newlyn during the six-year period from 1915 to 1921. It was in 1921 that Newlyn was selected as the country-wide datum, superseding Liverpool. It is applicable to all locations in mainland Britain. Heights can therefore be positive values, or negative values (when below ODN), for example deep basements.
- Mean Sea Level – in Mainland Britain, mean sea level is taken as ODN.
- Chart Datum – this is always for vertical measurements and varies between different locations. Chart Datum is unique to each location and commonly used for tide tables. It is normally the lowest, or near lowest tide level occurring under normal meteorological conditions. The value relative to ODN is usually given for that location. Therefore, heights using Chart Datum are usually positive values. The relationship between Chart Datum and ODN for selected UK and Irish ports is given in tables from the National Tidal and Sea Level Facility.
- Global Positioning System (GPS) and the OSGM15 TM model – the height transformation between the European Terrestrial Reference System 1989 and the national height datums is the preferred method of heighting used by Ordnance Survey. This method achieves the most accurate and uniform method of heighting. It is the Ordnance Survey definition of the current method of determining height in mainland Britain with great accuracy.
Belfast and Dublin have their own datums. Dublin’s Ordnance Datum was based on a low tide level that occurred on 8 April 1837 in Dublin Bay, so very close to its Chart Datum. Belfast’s Ordnance Datum was based on the average sea level at Belfast between 1951 and 1956. By 1970, the two datums had been consolidated into one datum, referred to as Malin Head Datum.
WHAT IS A BENCH MARK?
There are Fundamental Bench Marks (FBM) and Lower Order Bench Marks (BM). Each fulfil a similar role, providing the height of the Mark relative to ODN. There are about 190 FBM’s throughout mainland Britain, popularly known as Trig Points, consisting of the familiar pillar in the image (below), less than 2m tall with a brass bolt affixed to the upper surface – the brass bolt in each pillar has a defined height above ODN and these are maintained by Ordnance Survey. From these, some 750,000 BM’s were established between 1840 and 1985. They usually comprise the familiar shape as shown in the figure, and a horizontal angled groove, the apex of which is a defined level above ODN. These are typically located on walls or building facades within a metre or two of ground level.
BM’s are susceptible to loss by demolition of walls and buildings and are not now maintained by the Ordnance Survey, with reliance now placed on localised GPS-enabled surveying equipment. This Briefing Sheet (free to copy) prepared by the Institution of Civil Engineers is instructive. Additionally, these FBM’s and BM’s are liable in the long term to level distortion, particularly in mining areas, where ground heave or subsidence may occur.


WHY CHOOSE NEWLYN ORDNANCE?
Although the Ordnance Survey originated in 1791, it was between 1840 and 1860 that the first Geodetic Levelling of England, Wales and Scotland was conducted, establishing a network of FBMs with BMs, initially referred to a bench mark on the St. John’s Church in Liverpool, and subsequently to mean sea level. In due course, in tandem with more sophisticated levelling instruments, it was realised that the land mass was subject to variation. As such, a second Geodetic Survey was conducted between 1912 and 1921, also improving the long-term security of the FBM locations. But a more competent baseline mean sea level was needed and, to affect this, three new Tidal Observatories were established in 1913 at Dunbar, in 1915 at Newlyn, and in 1917 at Felixstowe.
Ongoing observations at these Tidal Observatories until 1921 indicated that there was good agreement of hourly sea levels between Newlyn and Felixstowe. Those at Dunbar were of the order of 0.25m higher, confirming that sea levels varied around the coast. As Newlyn was ideally placed to reflect tidal surges and their effects from the Atlantic, founded on a very stable land mass of rock, and on the edge of the Continental Shelf (reflecting conditions of the deep oceans), Newlyn was chosen as the new primary Datum point for mainland Britain from 1921.
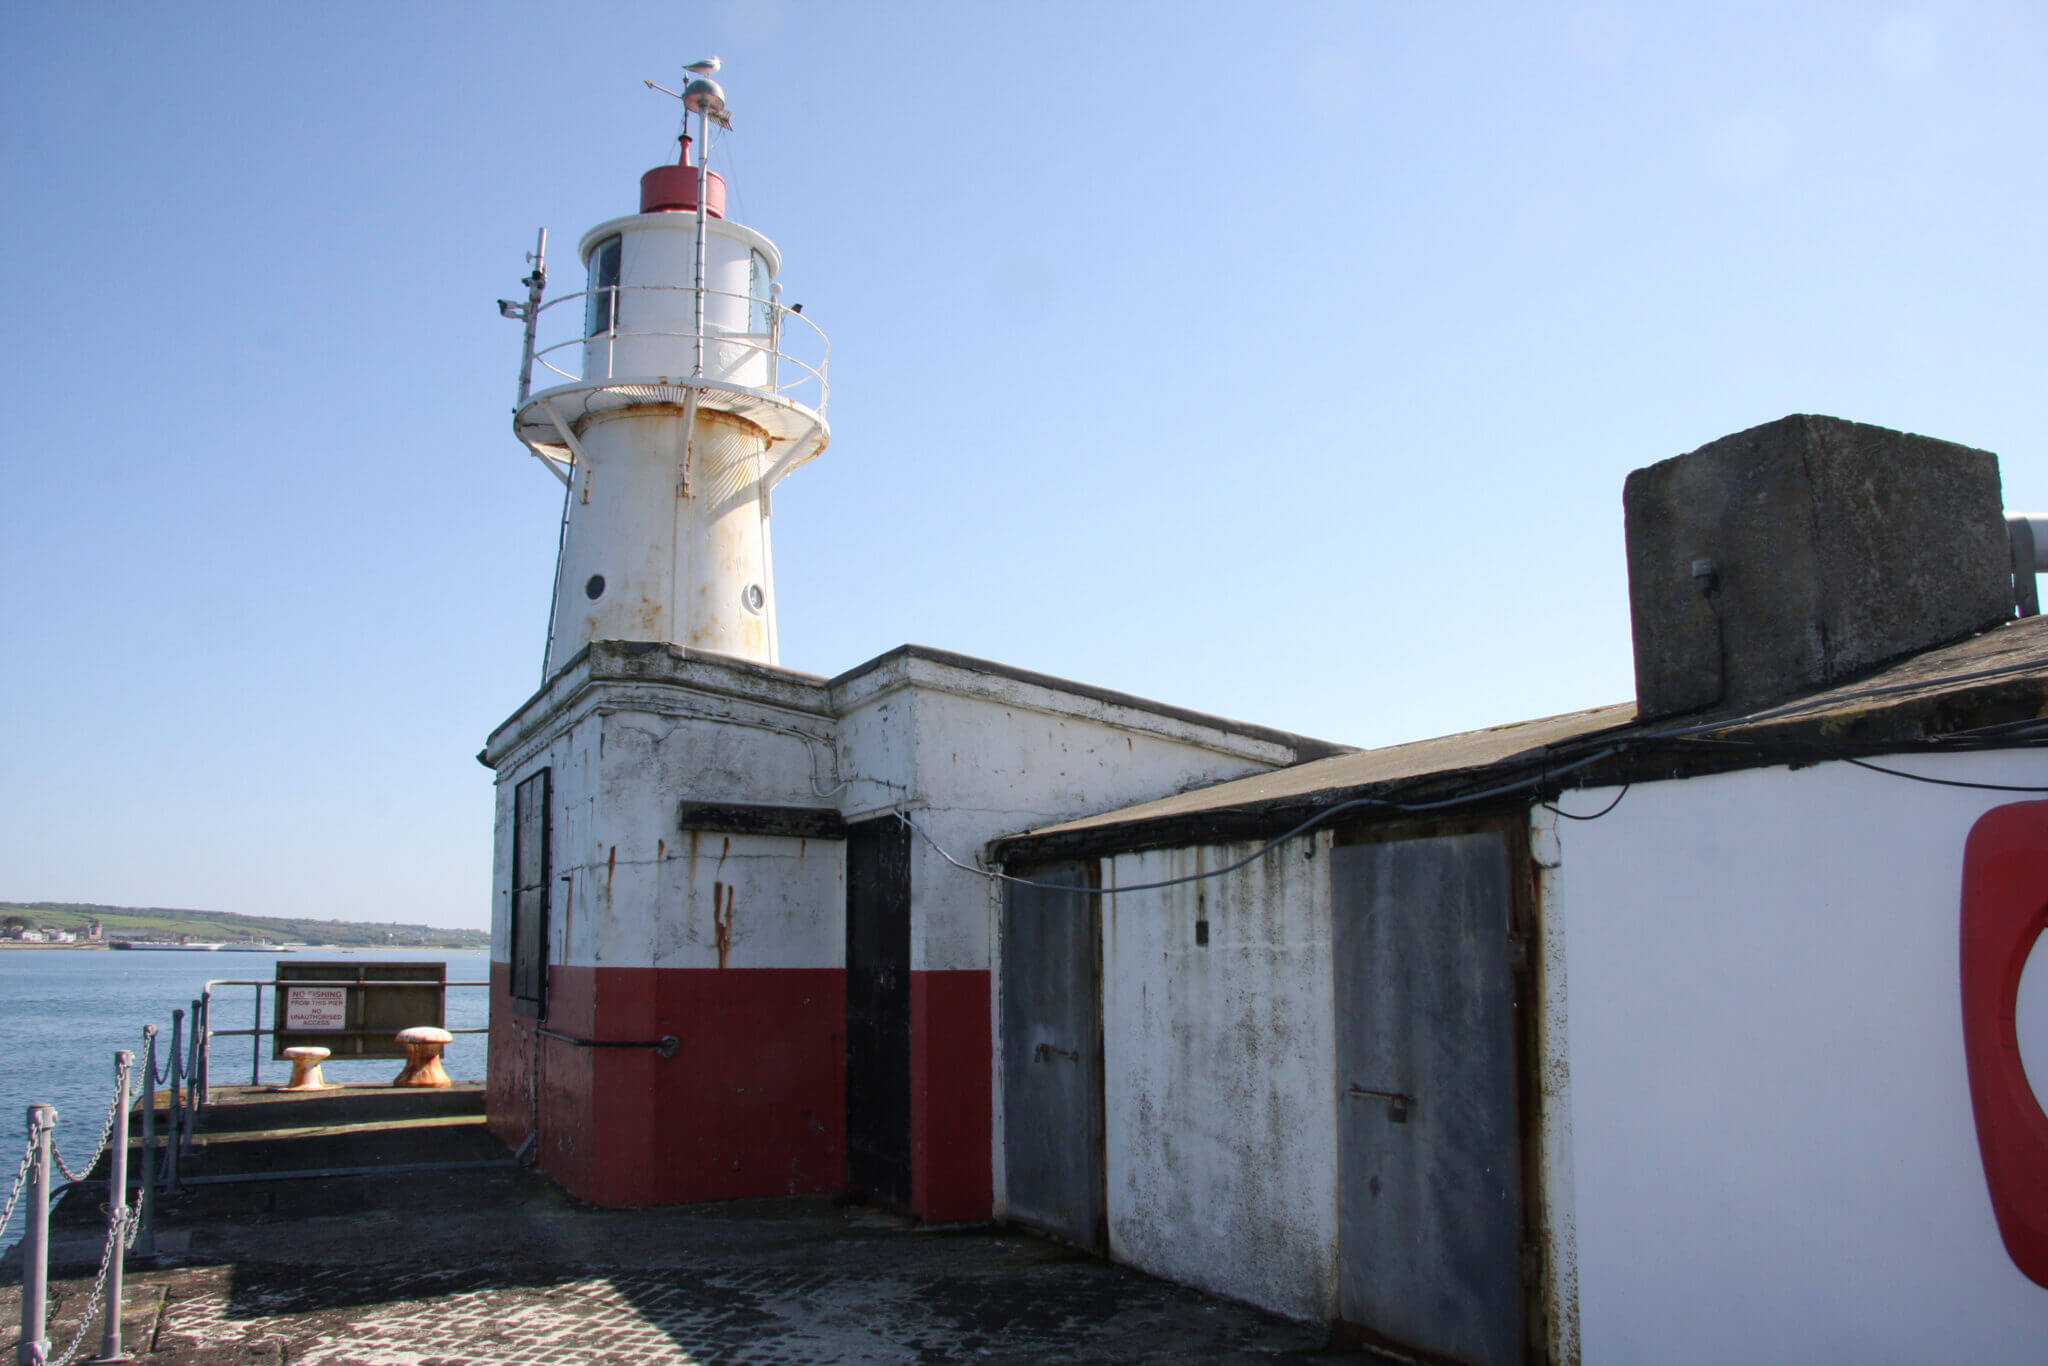
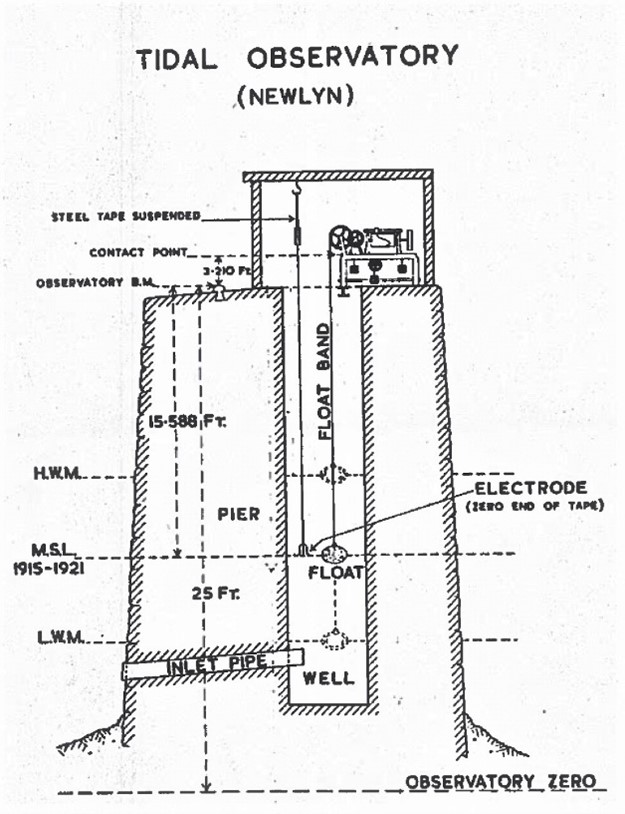
The Newlyn Tidal Observatory is situated at the end of the South Pier at Newlyn harbour. Details of its construction as required by the Ordnance Survey include: [NA: 1]
- A 5 ft. (c.1.52m) square shaft within the pier, from the top to 8 ft (c.2.44m) below lowest Spring tide complete with access to the base of the shaft. This was formed by concrete blocks.
- A 1 ft (c.0.3m) diameter connection between shaft and sea from the base of the shaft to the harbour side of the pier with an isolating valve.
- A stone or concrete building above for the apparatus.
Instrumentation was installed and the Observatory was commissioned on 21 April 1915. Sea levels were recorded hourly at Newlyn, Dunbar and Felixstowe.
At Newlyn, instrumentation included a float with a Cary Porter chart recorder, as indicated. Later in 1983, a bubbler with data logger was installed, taking advantage of technical progress. In 1988, a satellite antenna was installed that was used for continuous logging of variations in land levels. The antenna was mounted on the adjacent lighthouse [NA: 2]. (More information on tide gauge systems is available here).
“From 1 January 1984, the responsibility for the Observatory passed from the Ordnance Survey to the Proudman Oceanographic Laboratory in Birkenhead”. At the same time, “the Newlyn Tidal Observatory became part of the National tide Gauge Network for flood defence and scientific studies” [NA: 3]. More detail of instrumentation generally can be read here, with further links to the National Tidal Gauge Network, Tide Gauges, and Newlyn Tidal Observatory.
The Tidal Observatory and part of the South Pier at Newlyn was Grade II listed as of 11 December 2018. Its Historic England description can be read here.
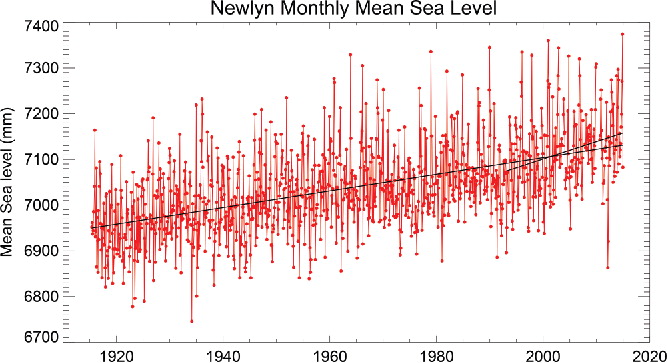
RISE IN SEA LEVEL
Due to the measurements from the Newlyn Tidal Observatory, it has been established that between 1915 and 2015 sea level at Newlyn has increased at 1.83mm/year and between 1993 and 2014 at 3.8mm/year, as shown below.
Acknowledgements and Bibliography:
Some of the above detail is derived from the booklet “The Newlyn Tidal Observatory” published by the Newlyn Archive, gratefully acknowledged.
NA: 1. Newlyn Archive. The Newlyn Tidal Observatory. Page 12
NA: 2. Newlyn Archive. The Newlyn Tidal Observatory. Pages 15, 16, 18, 32,33.
NA: 3. Newlyn Archive. The Newlyn Tidal Observatory. Page 31.
- Bradshaw et al. Accessed April 2021. E. Bradshaw, P.L. Woodworth, A. Hibbert, L.J. Bradley, D.T. Pugh, C. Fane & R.M. Bingley (2016) A Century of Sea Level Measurements at Newlyn, Southwest England, Marine Geodesy, 39:2, 115-140, DOI: 10.1080/01490419.2015.1121175. This is free to download subject to the conditions stated at https://doi.org/10.1080/01490419.2015.1121175